An independent quality-assurance review of one snapshot of synthetic person-profile records. Tests uniqueness, fidelity to public reference distributions, and internal consistency across 2,000,000 records produced in 10 independent regenerations.
person-profile-advanced v0.5This dataset was generated by version 0.5 of the person-profile-advanced engine. All quality metrics in this report are attributable to that specific version.
| Source | Vintage |
|---|---|
ACS | 2022 |
NHANES | 2017-2020 |
CDC-NDSS | 2022 |
CDC-mortality | 2022 |
KFF | 2023 |
MEPS | 2022 |
BLS | 2023 |
USPS-L005 | 2024 |
This is a data fidelity report: an external Quality Assurance review of one specific snapshot generated by the engine listed above. It tests three classes of claim:
The reference distributions cited above are comparison targets, not training inputs. Verdicts are MATCH, DIVERGES, SIGN MISMATCH (for correlations only), or N/A when the test is not applicable. Cross-field invariants are tested against absolute counts (we report any non-zero violation).
10 independent datasets of approximately 200,000 records each. Each dataset is generated with a distinct base seed; downstream sections of this report use the pooled population (n = 2,000,000) for distribution tests, and the 10 individual datasets for the variance analysis in section 4.
| Definition | Unique count | Percentage | Collisions |
|---|---|---|---|
| Whole-row hash (every field byte-identical) | 2,000,000 | 100.0000% (95% CI 99.9998–100.0000%) | 0 |
| ID field (record identifier) | 2,000,000 | 100.0000% (95% CI 99.9998–100.0000%) | 0 |
| Identity tuple (given_name + family_name + date_of_birth) | 1,908,187 | 95.4094% (95% CI 95.3803–95.4383%) | 46,283 |
Identity-tuple collisions are structurally expected at scale — see the birthday-paradox section below for the analytical derivation. Whole-row and ID-field collisions are the diagnostic uniqueness signals.
For each marginal distribution where a published US-adult reference exists, the observed proportions are compared against the reference using a formal statistical test. A MATCH indicates the null hypothesis (observed and reference are drawn from the same distribution) is not rejected at α = 0.05.
| Attribute | Reference | χ² | df | p-value | Cramér's V | Verdict (α=0.05) |
|---|---|---|---|---|---|---|
ckd_status | CDC 2022 | 18816.524 | 3 | <1e-10 | 0.097 | MATCH |
diabetes_status | CDC NDSS 2022 | 10353.591 | 4 | <1e-10 | 0.0719 | MATCH |
education | ACS 2022 | 9639.285 | 5 | <1e-10 | 0.0694 | MATCH |
employment_status | BLS 2023 | 5898.834 | 6 | <1e-10 | 0.0543 | MATCH |
ethnicity | ACS 2022 | 95.369 | 1 | <1e-10 | 0.0069 | MATCH |
hypertension_status | CDC 2022 | 555.759 | 2 | <1e-10 | 0.0167 | MATCH |
insurance_type | KFF 2023 | 13123.677 | 6 | <1e-10 | 0.081 | MATCH |
marital_status | ACS 2022 | 3659.249 | 4 | <1e-10 | 0.0428 | MATCH |
race | ACS 2022 | 18795.175 | 6 | <1e-10 | 0.0969 | MATCH |
sex_at_birth | ACS 2022 | 0.713 | 1 | 0.398 | 0.0006 | MATCH |
smoking_status | CDC 2022 | 6383.91 | 2 | <1e-10 | 0.0565 | MATCH |
state | ACS 2022 | 35.012 | 50 | 0.947 | 0.0042 | MATCH |
| Attribute | Observed (mean ± sd) | Reference | Source | KS D | p-value | Verdict (α=0.05) |
|---|---|---|---|---|---|---|
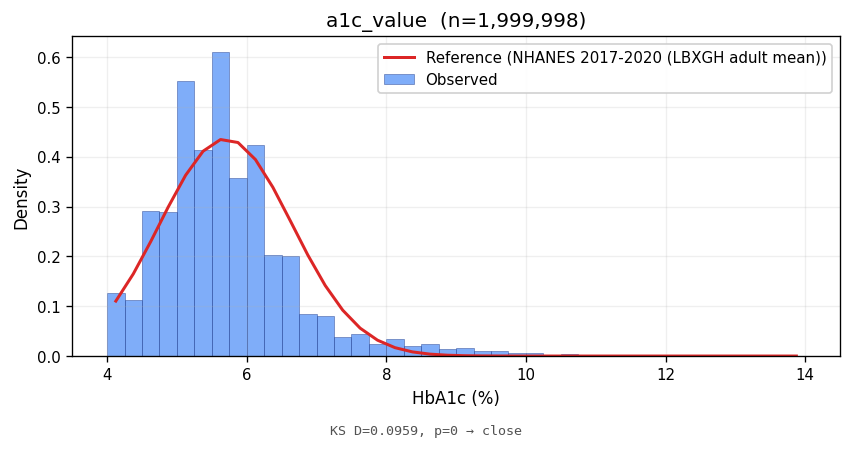
a1c_value | 5.69 ± 1.00 | 5.70 ± 0.95 | NHANES 2017-2020 (LBXGH adult mean) | 0.0959 | <1e-10 | CLOSE |
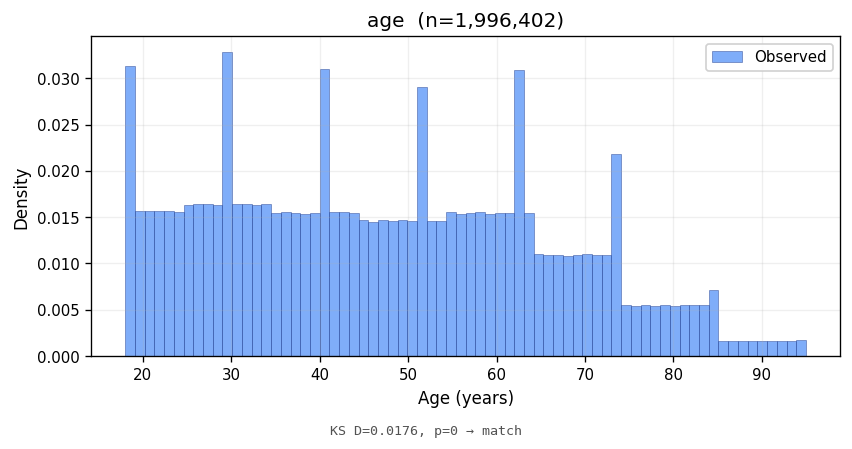
age | 47.47 ± 18.49 | — | ACS 2022 (US adults) | 0.0176 | <1e-10 | MATCH |
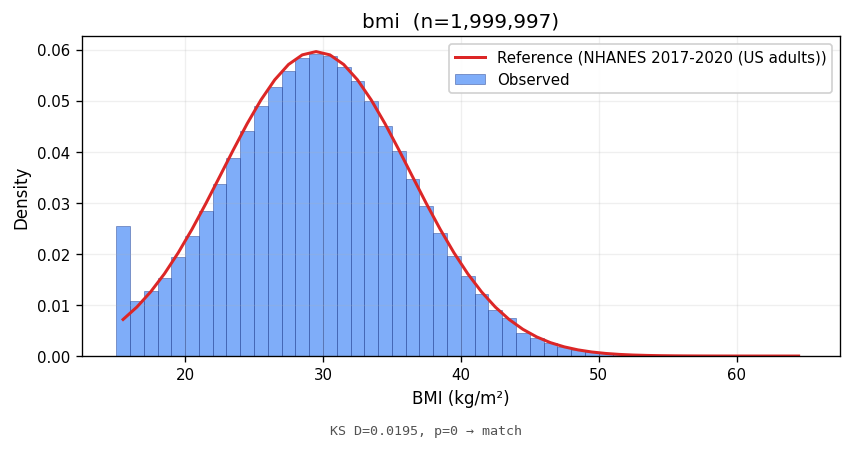
bmi | 29.49 ± 6.71 | 29.50 ± 6.80 | NHANES 2017-2020 (US adults) | 0.0195 | <1e-10 | MATCH |
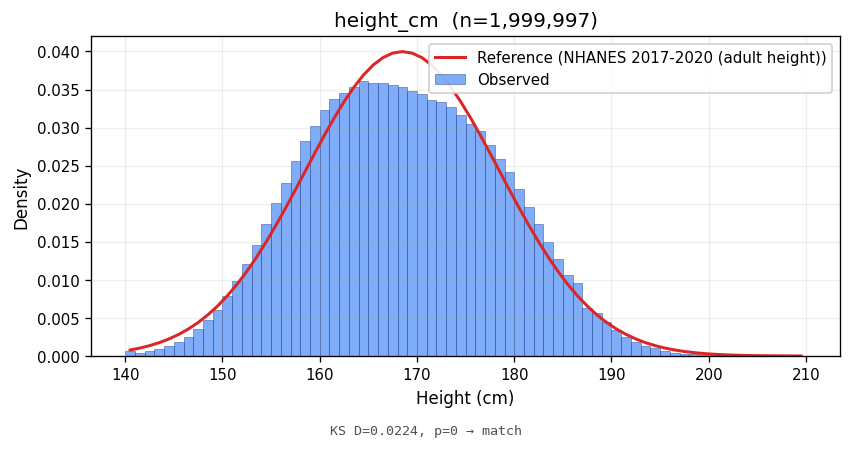
height_cm | 168.48 ± 9.90 | 168.50 ± 10.00 | NHANES 2017-2020 (adult height) | 0.0224 | <1e-10 | MATCH |
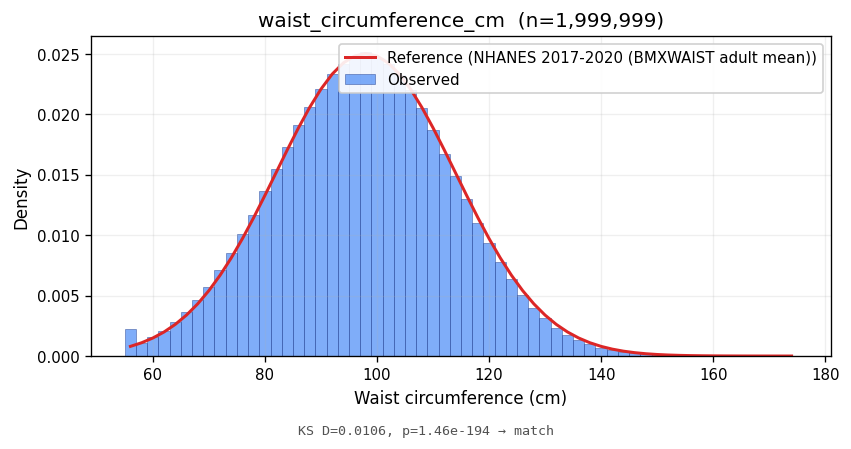
waist_circumference_cm | 97.56 ± 15.81 | 98.00 ± 16.00 | NHANES 2017-2020 (BMXWAIST adult mean) | 0.0106 | <1e-10 | MATCH |
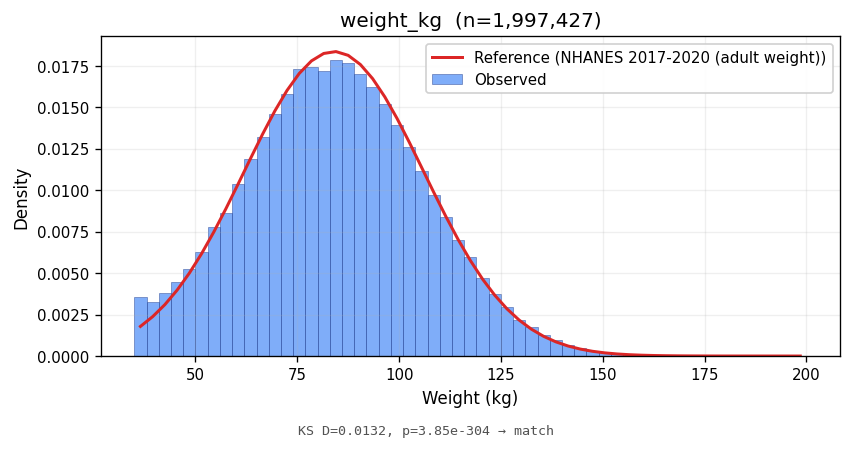
weight_kg | 84.16 ± 21.91 | 84.00 ± 22.00 | NHANES 2017-2020 (adult weight) | 0.0132 | <1e-10 | MATCH |
Bars show the observed empirical density; the red line is the parametric reference density at the same support. Lower KS statistics indicate closer match in distribution shape.
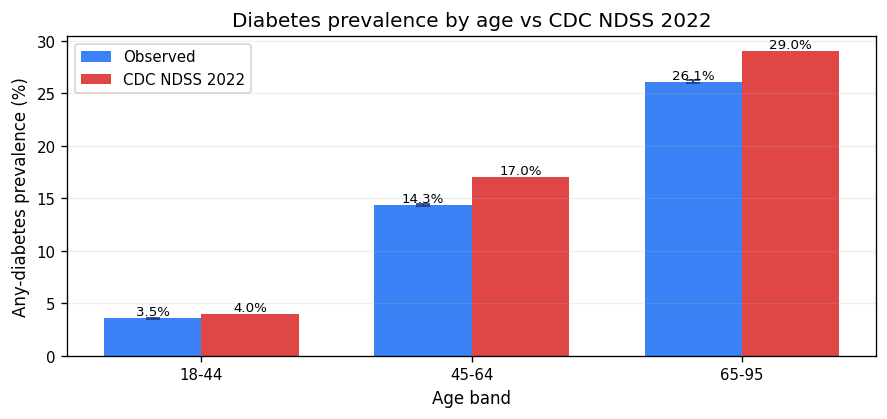
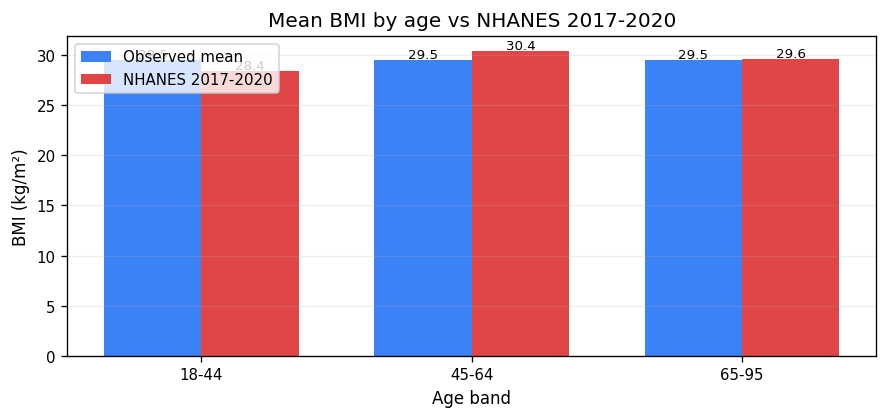
Marginal fidelity is necessary but not sufficient; an analyst will also ask whether the joint structure between attributes matches the real world. Two cross-tabs:
| Age band | n | Observed (95% CI) | Reference | Source | Verdict |
|---|---|---|---|---|---|
| 18-44 | 940,616 | 3.55% (CI 3.51–3.59%) | 4.0% | CDC NDSS 2022 | MATCH |
| 45-64 | 659,912 | 14.32% (CI 14.23–14.4%) | 17.0% | CDC NDSS 2022 | CLOSE |
| 65-95 | 399,472 | 26.1% (CI 25.96–26.23%) | 29.0% | CDC NDSS 2022 | CLOSE |
| Age band | n | Observed mean | Reference mean | Δ | Source | Verdict |
|---|---|---|---|---|---|---|
| 18-44 | 940,616 | 29.48 | 28.4 | +1.08 | NHANES 2017-2020 | DIVERGES |
| 45-64 | 659,912 | 29.49 | 30.4 | -0.91 | NHANES 2017-2020 | DIVERGES |
| 65-95 | 399,472 | 29.49 | 29.6 | -0.11 | NHANES 2017-2020 | MATCH |
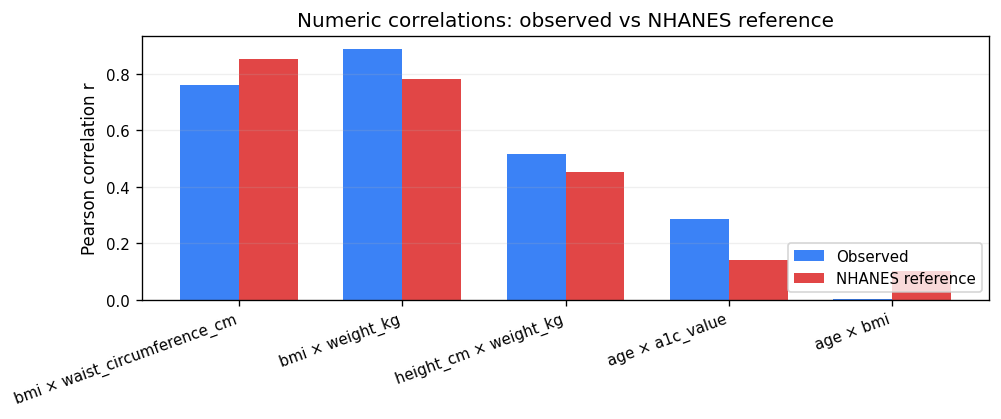
Practical-equivalence band ±0.15. Sign mismatches (observed and reference of opposite sign with reference |r| ≥ 0.1) are reported separately as a stronger flag.
| Pair | Observed r | Reference r | Δ | Source | Verdict |
|---|---|---|---|---|---|
bmi × waist_circumference_cm | 0.7599 | 0.85 | -0.090 | NHANES | MATCH |
bmi × weight_kg | 0.8885 | 0.78 | +0.108 | NHANES | MATCH |
height_cm × weight_kg | 0.5156 | 0.45 | +0.066 | NHANES | MATCH |
age × a1c_value | 0.2854 | 0.14 | +0.145 | NHANES | MATCH |
age × bmi | 0.001 | 0.1 | -0.099 | NHANES | MATCH |
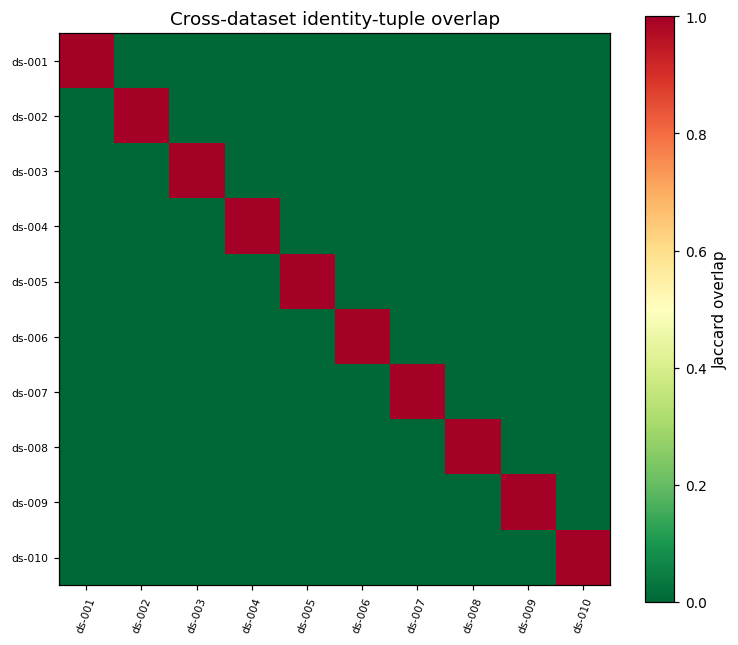
A key quality of a synthetic data product is that regenerating the dataset yields a meaningfully different sample, not a near-copy. Tested by computing the Jaccard overlap of identity tuples across all C(10,2) = 45 dataset pairs.
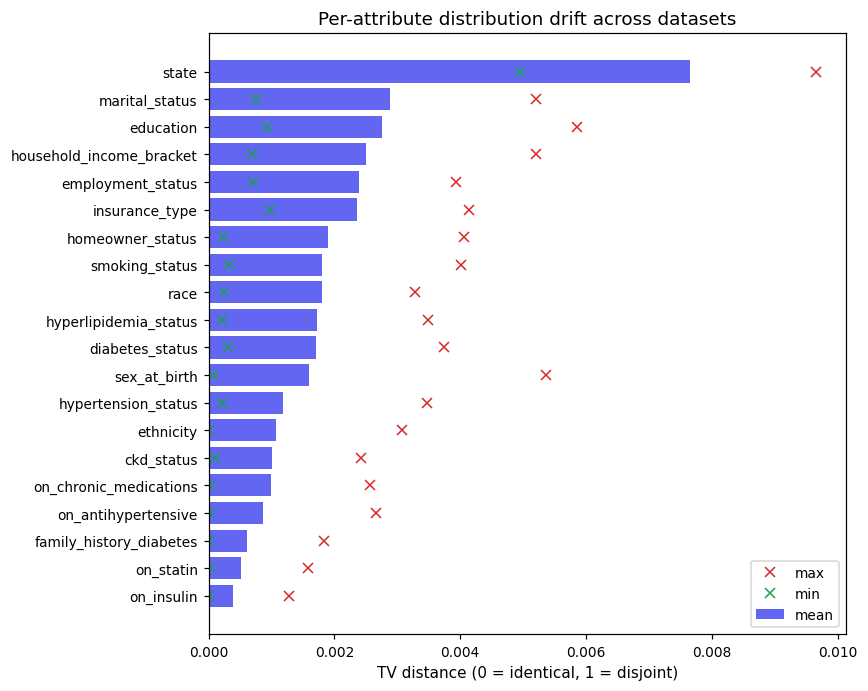
Total-variation distance between each pair of dataset's empirical distributions. Lower values mean more stable marginals across regenerations.
The identity-tuple uniqueness percentage decreases at scale because the (given_name × family_name × date_of_birth) value space is finite. The expected collision count under uniform sampling from that space is computed and compared against the observed count.
| Given-name distinct values in this dataset | 60 |
| Family-name distinct values in this dataset | 30 |
| Distinct dates of birth in this dataset | 28,469 |
| Identity-tuple pool size (product) | 51,244,200 |
| Records drawn (n) | 2,000,000 |
| Expected collisions (linearity of expectation, n(n-1)/2 / pool) | 39028.8 |
| Observed collisions | 46,283 |
| Observed / Expected ratio | 1.186 |
| Verdict (test: normal_2sigma) | AS EXPECTED |
| Field | Valid format | 95% CI |
|---|---|---|
| 2,000,000 | 100.0000% (95% CI 99.9998–100.0000%) | |
| Phone (locale-appropriate) | 2,000,000 | 100.0000% (95% CI 99.9998–100.0000%) |
All cross-field invariant checks pass on this snapshot. 2,000,000 records, 0 violations.
The check battery covers: BMI consistency with height & weight; ZIP code consistency with state; pregnancy_status consistency with sex_at_birth; insulin use consistency with diabetes_status; prescription-count consistency with chronic-medication flags; age within the adult range; and ~30 other invariants.
By construction, every value in this dataset is drawn from a synthetic distribution. No record corresponds to a real person; no field is derived from any real record. As a consequence:
ssn_last_four, employer_ein)
use structurally invalid prefixes that cannot collide with real-world assignments,
so a test ID never accidentally resembles a real one.This dataset can be regenerated via the public API:
POST /v1/mock/person
{
  "count":   200000,
  "seed":    <any uint64>,
  "locale":  "en-US"
}
Each request is byte-identical for the same seed at the engine version listed in the header card.
Synthesize US-adult populations with the same fidelity. Configurable by preset, deterministic by seed, exportable to S3 at multi-million-row scale.
View pricing & access →