An independent quality-assurance review of a single large snapshot of synthetic person-profile records, generated end-to-end as one job. Tests uniqueness, fidelity to public reference distributions, and internal consistency at 2,000,000-record scale.
person-profile-advanced v0.5This dataset was generated by version 0.5 of the person-profile-advanced engine. All quality metrics in this report are attributable to that specific version.
| Source | Vintage |
|---|---|
ACS | 2022 |
NHANES | 2017-2020 |
CDC-NDSS | 2022 |
CDC-mortality | 2022 |
KFF | 2023 |
MEPS | 2022 |
BLS | 2023 |
USPS-L005 | 2024 |
This is a data fidelity report: an external Quality Assurance review of one specific snapshot generated by the engine listed above. It tests three classes of claim:
The reference distributions cited above are comparison targets, not training inputs. Verdicts are MATCH, DIVERGES, SIGN MISMATCH (for correlations only), or N/A when the test is not applicable. Cross-field invariants are tested against absolute counts (we report any non-zero violation).
| Definition | Unique count | Percentage | Collisions |
|---|---|---|---|
| Whole-row hash (every field byte-identical) | 2,000,000 | 100.0000% (95% CI 99.9998–100.0000%) | 0 |
| ID field (record identifier) | 2,000,000 | 100.0000% (95% CI 99.9998–100.0000%) | 0 |
| Identity tuple (given_name + family_name + date_of_birth) | 1,908,416 | 95.4208% (95% CI 95.3917–95.4497%) | 46,166 |
Identity-tuple collisions are structurally expected at scale — see the birthday-paradox section below for the analytical derivation. Whole-row and ID-field collisions are the diagnostic uniqueness signals.
For each marginal distribution where a published US-adult reference exists, the observed proportions are compared against the reference using a formal statistical test. A MATCH indicates the null hypothesis (observed and reference are drawn from the same distribution) is not rejected at α = 0.05.
| Attribute | Reference | χ² | df | p-value | Cramér's V | Verdict (α=0.05) |
|---|---|---|---|---|---|---|
ckd_status | CDC 2022 | 19194.968 | 3 | <1e-10 | 0.098 | MATCH |
diabetes_status | CDC NDSS 2022 | 10122.693 | 4 | <1e-10 | 0.0711 | MATCH |
education | ACS 2022 | 9307.666 | 5 | <1e-10 | 0.0682 | MATCH |
employment_status | BLS 2023 | 6135.072 | 6 | <1e-10 | 0.0554 | MATCH |
ethnicity | ACS 2022 | 124.31 | 1 | <1e-10 | 0.0079 | MATCH |
hypertension_status | CDC 2022 | 499.426 | 2 | <1e-10 | 0.0158 | MATCH |
insurance_type | KFF 2023 | 12906.311 | 6 | <1e-10 | 0.0803 | MATCH |
marital_status | ACS 2022 | 3652.099 | 4 | <1e-10 | 0.0427 | MATCH |
race | ACS 2022 | 19275.245 | 6 | <1e-10 | 0.0982 | MATCH |
sex_at_birth | ACS 2022 | 0.049 | 1 | 0.825 | 0.0002 | MATCH |
smoking_status | CDC 2022 | 6663.676 | 2 | <1e-10 | 0.0577 | MATCH |
state | ACS 2022 | 69.128 | 50 | 0.038 | 0.0059 | MATCH |
| Attribute | Observed (mean ± sd) | Reference | Source | KS D | p-value | Verdict (α=0.05) |
|---|---|---|---|---|---|---|
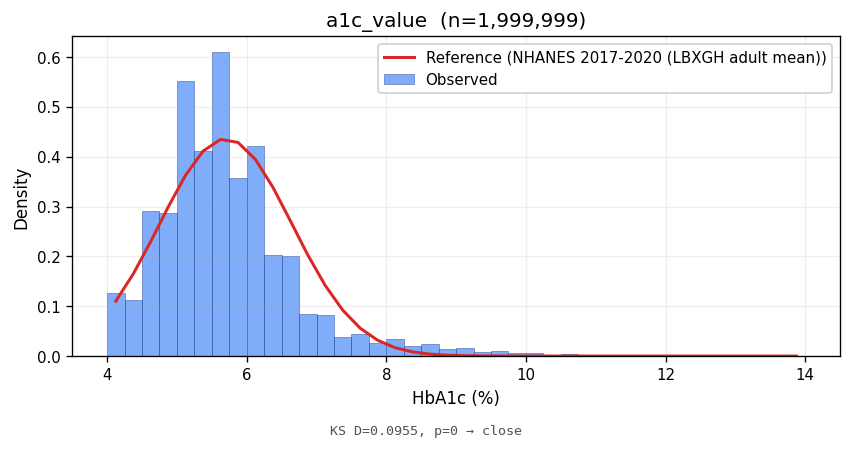
a1c_value | 5.69 ± 1.00 | 5.70 ± 0.95 | NHANES 2017-2020 (LBXGH adult mean) | 0.0955 | <1e-10 | CLOSE |
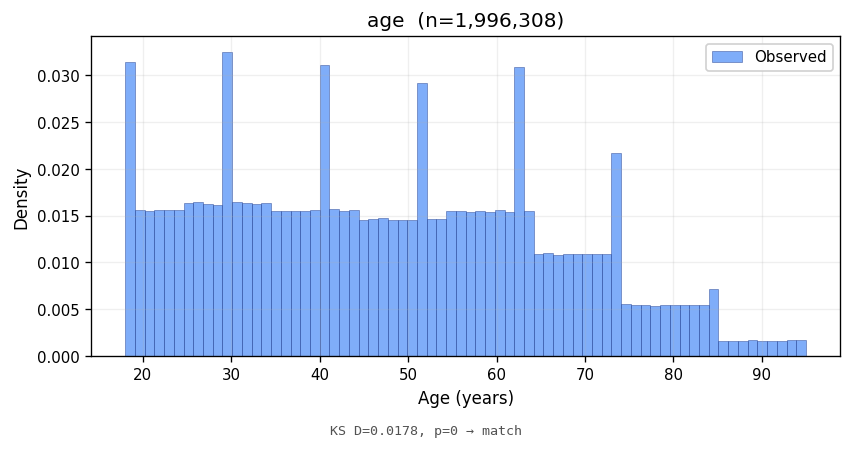
age | 47.49 ± 18.49 | — | ACS 2022 (US adults) | 0.0178 | <1e-10 | MATCH |
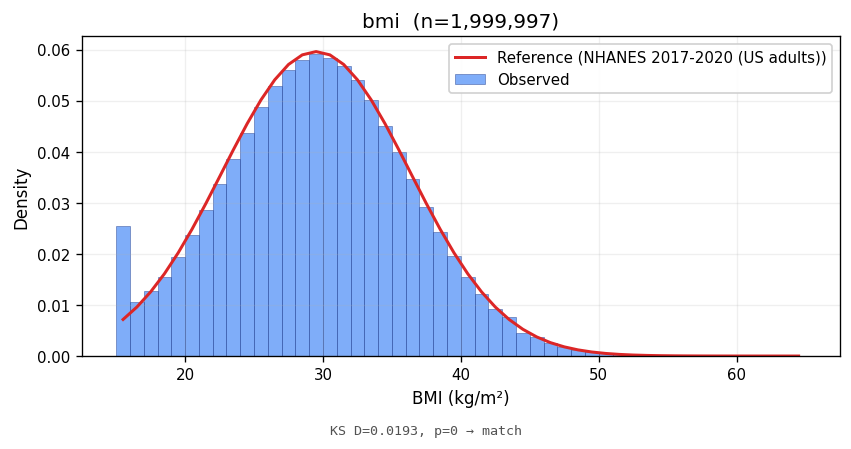
bmi | 29.49 ± 6.72 | 29.50 ± 6.80 | NHANES 2017-2020 (US adults) | 0.0193 | <1e-10 | MATCH |
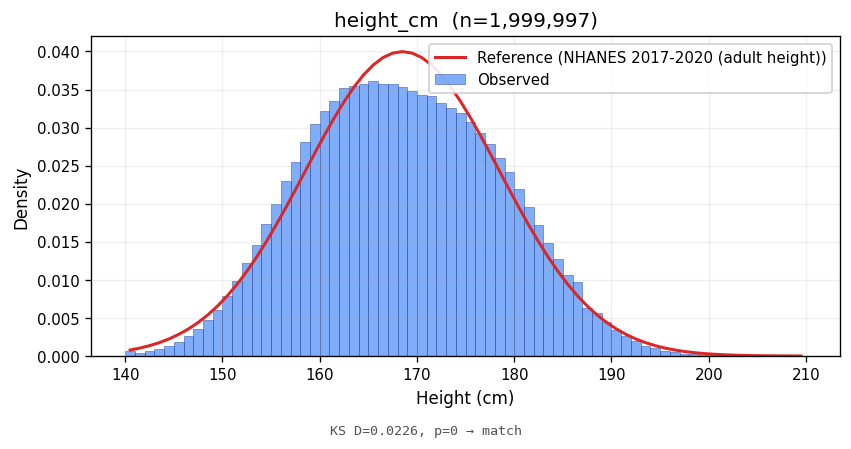
height_cm | 168.48 ± 9.90 | 168.50 ± 10.00 | NHANES 2017-2020 (adult height) | 0.0226 | <1e-10 | MATCH |
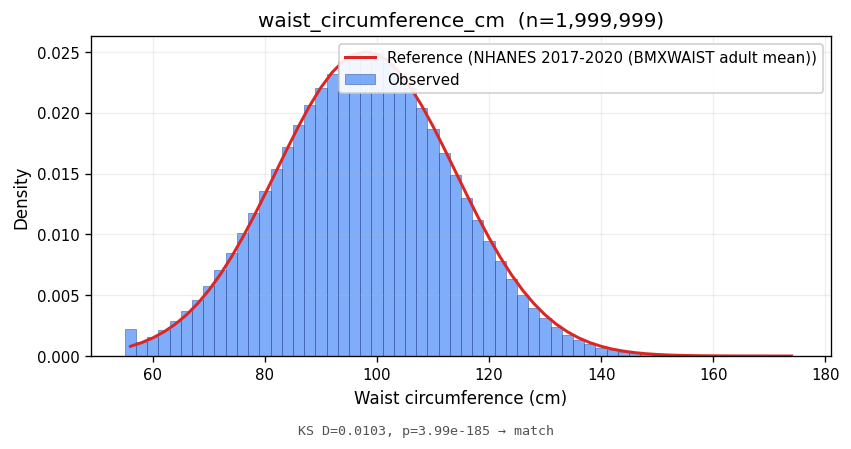
waist_circumference_cm | 97.56 ± 15.82 | 98.00 ± 16.00 | NHANES 2017-2020 (BMXWAIST adult mean) | 0.0103 | <1e-10 | MATCH |
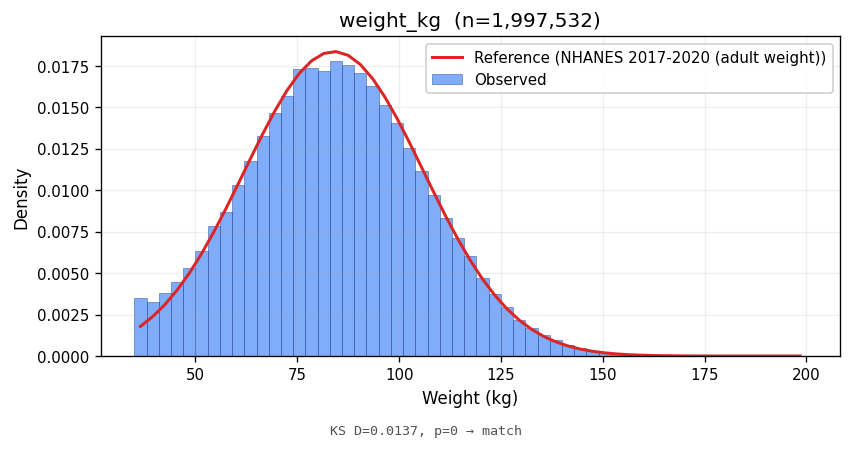
weight_kg | 84.18 ± 21.93 | 84.00 ± 22.00 | NHANES 2017-2020 (adult weight) | 0.0137 | <1e-10 | MATCH |
Bars show the observed empirical density; the red line is the parametric reference density at the same support.
| Age band | n | Observed (95% CI) | Reference | Source | Verdict |
|---|---|---|---|---|---|
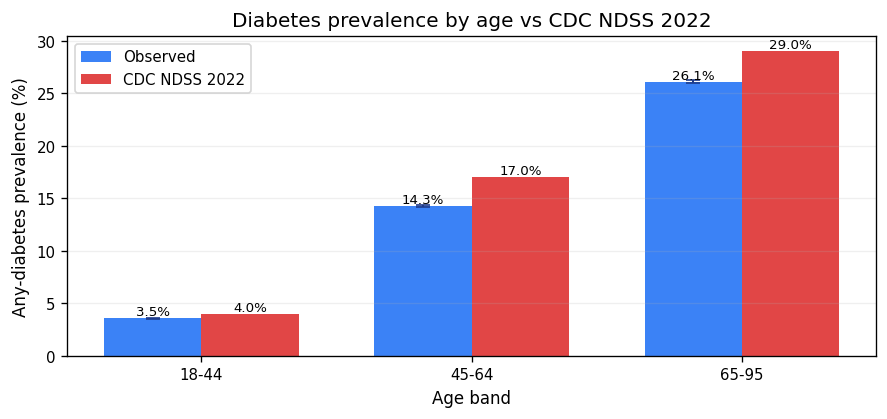
| 18-44 | 940,227 | 3.55% (CI 3.52–3.59%) | 4.0% | CDC NDSS 2022 | MATCH |
| 45-64 | 660,317 | 14.26% (CI 14.18–14.34%) | 17.0% | CDC NDSS 2022 | CLOSE |
| 65-95 | 399,456 | 26.09% (CI 25.96–26.23%) | 29.0% | CDC NDSS 2022 | CLOSE |
| Age band | n | Observed mean | Reference mean | Δ | Source | Verdict |
|---|---|---|---|---|---|---|
| 18-44 | 940,227 | 29.49 | 28.4 | +1.09 | NHANES 2017-2020 | DIVERGES |
| 45-64 | 660,317 | 29.5 | 30.4 | -0.90 | NHANES 2017-2020 | DIVERGES |
| 65-95 | 399,456 | 29.49 | 29.6 | -0.11 | NHANES 2017-2020 | MATCH |
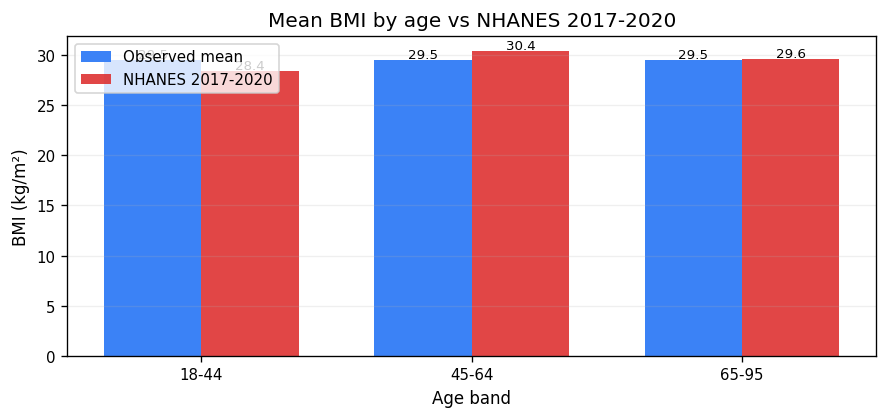
Practical-equivalence band ±0.15. Sign mismatches reported separately.
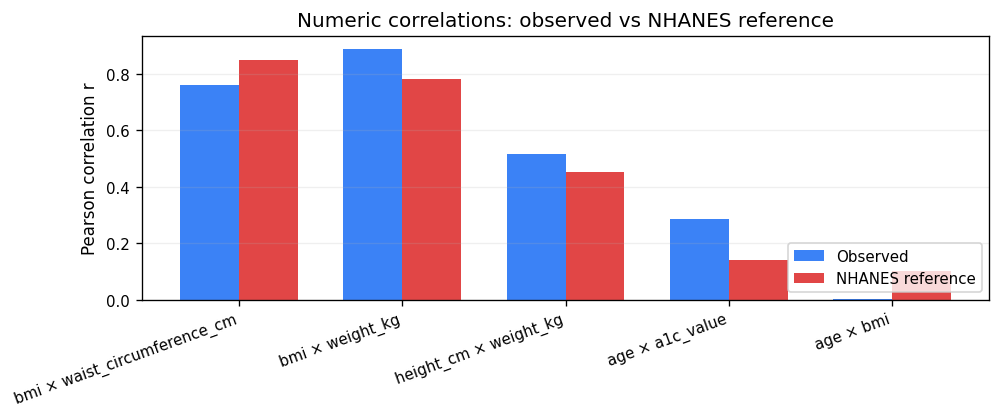
| Pair | Observed r | Reference r | Δ | Source | Verdict |
|---|---|---|---|---|---|
bmi × waist_circumference_cm | 0.7604 | 0.85 | -0.090 | NHANES | MATCH |
bmi × weight_kg | 0.8888 | 0.78 | +0.109 | NHANES | MATCH |
height_cm × weight_kg | 0.5162 | 0.45 | +0.066 | NHANES | MATCH |
age × a1c_value | 0.2851 | 0.14 | +0.145 | NHANES | MATCH |
age × bmi | 0.0001 | 0.1 | -0.100 | NHANES | MATCH |
The identity-tuple uniqueness percentage decreases at scale because the (given_name × family_name × date_of_birth) value space is finite. The expected collision count is computed and compared against the observed.
| Given-name distinct values in this dataset | 60 |
| Family-name distinct values in this dataset | 30 |
| Distinct dates of birth in this dataset | 28,470 |
| Identity-tuple pool size (product) | 51,246,000 |
| Records drawn (n) | 2,000,000 |
| Expected collisions (linearity of expectation, n(n-1)/2 / pool) | 39027.4 |
| Observed collisions | 46,166 |
| Observed / Expected ratio | 1.183 |
| Verdict (test: normal_2sigma) | AS EXPECTED |
| Field | Valid format | 95% CI |
|---|---|---|
| 2,000,000 | 100.0000% (95% CI 99.9998–100.0000%) | |
| Phone | 2,000,000 | 100.0000% (95% CI 99.9998–100.0000%) |
All cross-field invariant checks pass on this snapshot. 2,000,000 records, 0 violations.
The check battery covers: BMI consistency with height & weight; ZIP code consistency with state; pregnancy_status consistency with sex_at_birth; insulin use consistency with diabetes_status; prescription-count consistency with chronic-medication flags; age within the adult range; and ~30 other invariants.
By construction, every value in this dataset is drawn from a synthetic distribution. No record corresponds to a real person; no field is derived from any real record. As a consequence:
ssn_last_four, employer_ein)
use structurally invalid prefixes that cannot collide with real-world assignments,
so a test ID never accidentally resembles a real one.Datasets of this size can be requested via the asynchronous endpoint:
POST /v1/datasets/person
{
  "count":   2000000,
  "seed":    <any uint64>,
  "locale":  "en-US",
  "preset":  "us_2024_adults"
}
The endpoint returns a job ID; poll for completion and retrieve a download link from the status endpoint. Each request with the same seed produces the same dataset at the engine version listed in the header.
Synthesize US-adult populations with the same fidelity. Configurable by preset, deterministic by seed, exportable to S3 at multi-million-row scale.
View pricing & access →